- Published on
k3d, Prometheus, Grafana and k6
- Authors
- Name
- Kornel Warwas
- Name
- Włodzimierz Kesler


Overview
- Intro
- Create single-node cluster
- Check single-node cluster
- Install kube-prometheus-stack
- Check kube-prometheus-stack deployment
- Get Grafana login password
- Deploy sample application
- File structure
- hello-deployment.yml file
- hello-service.yml file
- Deploy command
- Check deployment
- Run some HTTP requests
- Hello App port forwarding
- Sample k6 script
- Run k6 tests
- Run Grafana
- Port forwarding
- Login screen
- Dashboards
- Example screen 1
- Example screen 2
- Destroy Kubernetes cluster
- What about multi-node cluster?
- Create multi-node cluster
- Check multi-node cluster
- Deploy kube-prometheus-stack
Intro
k3d is a lightweight wrapper to run k3s (Rancher Lab’s minimal Kubernetes distribution) in docker. k3d makes it very easy to create single- and multi-node k3s clusters in docker, e.g. for local development on Kubernetes.
See more: k3d
Prometheus is an open source systems monitoring toolkit originally developed by SoundCloud. Prometheus joined the Cloud Native Computing Foundation in 2016 as the second hosted project, after Kubernetes.
See more: Prometheus
The Prometheus Operator provides Kubernetes native deployment and management of Prometheus and related monitoring components. The purpose of this project is to simplify and automate the configuration of a Prometheus based monitoring stack for Kubernetes clusters. The Prometheus Operator uses Kubernetes custom resources to simplify the deployment and configuration of Prometheus, Alertmanager, and related monitoring components.
See more: Prometheus Operator
Grafana allows you to query, visualize, alert on and understand your metrics no matter where they are stored. Create, explore, and share beautiful dashboards with your team and foster a data driven culture.
See more: Grafana
k6 is an open-source load testing tool that makes performance testing easy and productive for engineering teams. k6 is free, developer-centric, and extensible.
See more: k6
Create single-node cluster
k3d cluster create --no-lb --k3s-arg "--disable=traefik@server:0"
Check single-node cluster
k3d cluster list
Example output:
NAME          SERVERS   AGENTS   LOADBALANCER
k3s-default   1/1       0/0      false
Install kube-prometheus-stack
kube-prometheus-stack collects Kubernetes manifests, Grafana dashboards, and Prometheus rules combined with documentation and scripts to provide easy to operate end-to-end Kubernetes cluster monitoring with Prometheus using the Prometheus Operator.
helm repo add prometheus-community https://prometheus-community.github.io/helm-charts
helm update
helm install kube-prometheus-stack prometheus-community/kube-prometheus-stack -n monitoring --create-namespace
See more: kube-prometheus-stack
Check kube-prometheus-stack deployment
kubectl get all -n monitoring
Example output:
NAME                                                           READY   STATUS    RESTARTS   AGE
pod/kube-prometheus-stack-prometheus-node-exporter-kn4ck       1/1     Running   0          5d21h
pod/kube-prometheus-stack-operator-645bb9bcbb-ss79m            1/1     Running   0          5d21h
pod/alertmanager-kube-prometheus-stack-alertmanager-0          2/2     Running   0          5d21h
pod/kube-prometheus-stack-kube-state-metrics-fd9695984-vppcq   1/1     Running   0          5d21h
pod/kube-prometheus-stack-grafana-f9b867c48-p6w95              3/3     Running   0          5d21h
pod/prometheus-kube-prometheus-stack-prometheus-0              2/2     Running   0          5d21h

NAME                                                     TYPE        CLUSTER-IP      EXTERNAL-IP   PORT(S)                      AGE
service/kube-prometheus-stack-grafana                    ClusterIP   10.43.175.18    <none>        80/TCP                       5d21h
service/kube-prometheus-stack-prometheus                 ClusterIP   10.43.208.54    <none>        9090/TCP                     5d21h
service/kube-prometheus-stack-kube-state-metrics         ClusterIP   10.43.161.228   <none>        8080/TCP                     5d21h
service/kube-prometheus-stack-prometheus-node-exporter   ClusterIP   10.43.123.29    <none>        9100/TCP                     5d21h
service/kube-prometheus-stack-alertmanager               ClusterIP   10.43.203.199   <none>        9093/TCP                     5d21h
service/kube-prometheus-stack-operator                   ClusterIP   10.43.191.53    <none>        443/TCP                      5d21h
service/alertmanager-operated                            ClusterIP   None            <none>        9093/TCP,9094/TCP,9094/UDP   5d21h
service/prometheus-operated                              ClusterIP   None            <none>        9090/TCP                     5d21h

NAME                                                            DESIRED   CURRENT   READY   UP-TO-DATE   AVAILABLE   NODE SELECTOR   AGE
daemonset.apps/kube-prometheus-stack-prometheus-node-exporter   1         1         1       1            1           <none>          5d21h

NAME                                                       READY   UP-TO-DATE   AVAILABLE   AGE
deployment.apps/kube-prometheus-stack-operator             1/1     1            1           5d21h
deployment.apps/kube-prometheus-stack-kube-state-metrics   1/1     1            1           5d21h
deployment.apps/kube-prometheus-stack-grafana              1/1     1            1           5d21h

NAME                                                                 DESIRED   CURRENT   READY   AGE
replicaset.apps/kube-prometheus-stack-operator-645bb9bcbb            1         1         1       5d21h
replicaset.apps/kube-prometheus-stack-kube-state-metrics-fd9695984   1         1         1       5d21h
replicaset.apps/kube-prometheus-stack-grafana-f9b867c48              1         1         1       5d21h

NAME                                                               READY   AGE
statefulset.apps/alertmanager-kube-prometheus-stack-alertmanager   1/1     5d21h
statefulset.apps/prometheus-kube-prometheus-stack-prometheus       1/1     5d21h
Get Grafana login password
kubectl get secret --namespace monitoring kube-prometheus-stack-grafana -o jsonpath="{.data.admin-password}" | base64 --decode ; echo
Example output:
prom-operator
Deploy sample application
File structure
hello-app
├── hello-deployment.yml
└── hello-service.yml
hello-deployment.yml file
apiVersion: apps/v1
kind: Deployment
metadata:
  name: hello-app
  labels:
    app: hello-app
spec:
  replicas: 3
  template:
    metadata:
      name: hello-app
      labels:
        app: hello-app
    spec:
      containers:
        - name: hello-app
          image: paulbouwer/hello-kubernetes:1.10
          imagePullPolicy: IfNotPresent
      restartPolicy: Always
  selector:
    matchLabels:
      app: hello-app
hello-service.yml file
apiVersion: v1
kind: Service
metadata:
  name: hello-app
spec:
  selector:
    app: hello-app
  ports:
    - port: 8080
      # By default and for convenience, the targetPort is set to the same value as the port field. https://kubernetes.io/docs/concepts/services-networking/service/
      # targetPort: 8080
Deploy command
kubectl apply -f hello-app
Check deployment
kubectl get all
Example output:
NAME                             READY   STATUS    RESTARTS   AGE
pod/hello-app-7d458d7dd-8x9pj    1/1     Running   0          5d21h
pod/hello-app-7d458d7dd-ch647    1/1     Running   0          5d21h
pod/hello-app-7d458d7dd-cwdlj    1/1     Running   0          5d21h

NAME                 TYPE        CLUSTER-IP      EXTERNAL-IP   PORT(S)    AGE
service/kubernetes   ClusterIP   10.43.0.1       <none>        443/TCP    5d21h
service/hello-app    ClusterIP   10.43.144.183   <none>        8080/TCP   5d21h

NAME                        READY   UP-TO-DATE   AVAILABLE   AGE
deployment.apps/hello-app   3/3     3            3           5d21h

NAME                                   DESIRED   CURRENT   READY   AGE
replicaset.apps/hello-app-7d458d7dd    3         3         3       5d21h
Run some HTTP requests
Hello App port forwarding
kubectl port-forward service/hello-app 8080:8080
Sample k6 script
import http from 'k6/http';
import { sleep, check } from 'k6';

export const options = {
  stages: [
    { target: 10, duration: '10s' },
    { target: 20, duration: '10s' },
    { target: 0, duration: '10s' },
  ],
};

export default function () {
  const res = http.get('http://localhost:8080/');

  sleep(1);

  const checkRes = check(res, {
    'status is 200': (r) => r.status === 200
  });
}
The script shown above is only a simple example with short test stages duration. To get more reliable results in Grafana, you can use the script: k6-stress-testing
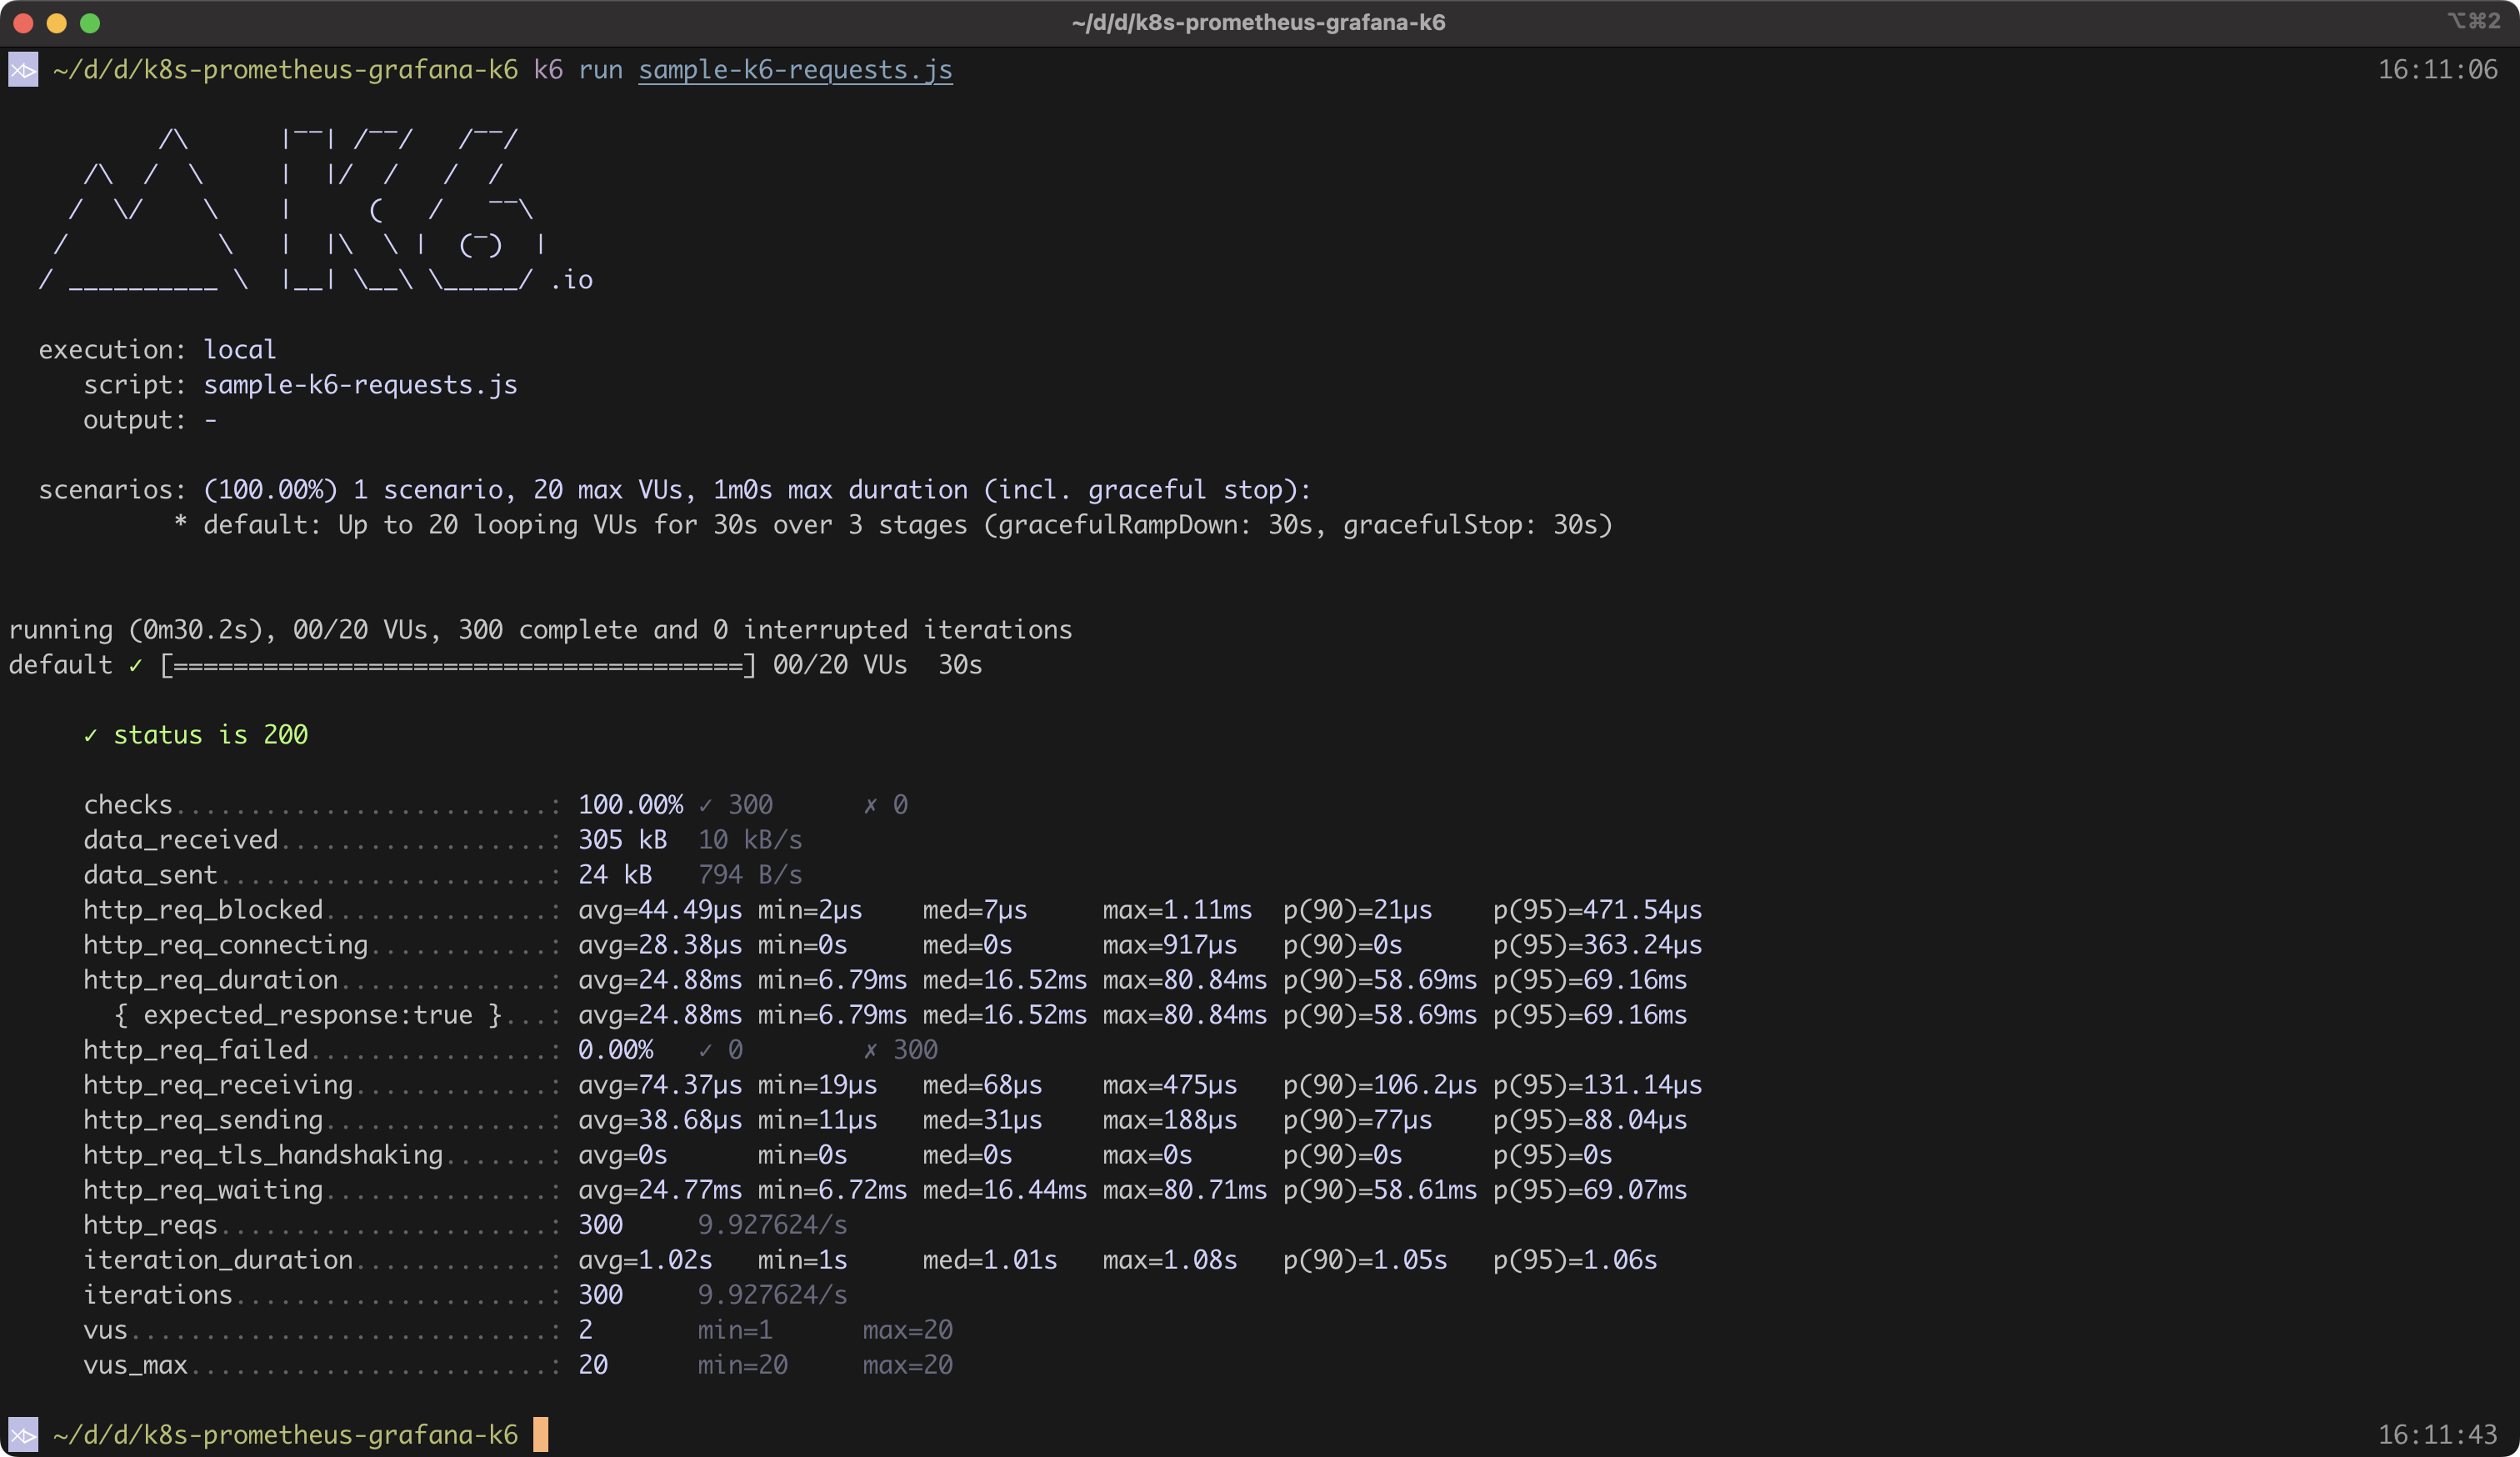
Run k6 tests
k6 run sample-k6-requests.js
Example output:

Run Grafana
Port forwarding
kubectl port-forward service/kube-prometheus-stack-grafana -n monitoring 8081:80
Login screen

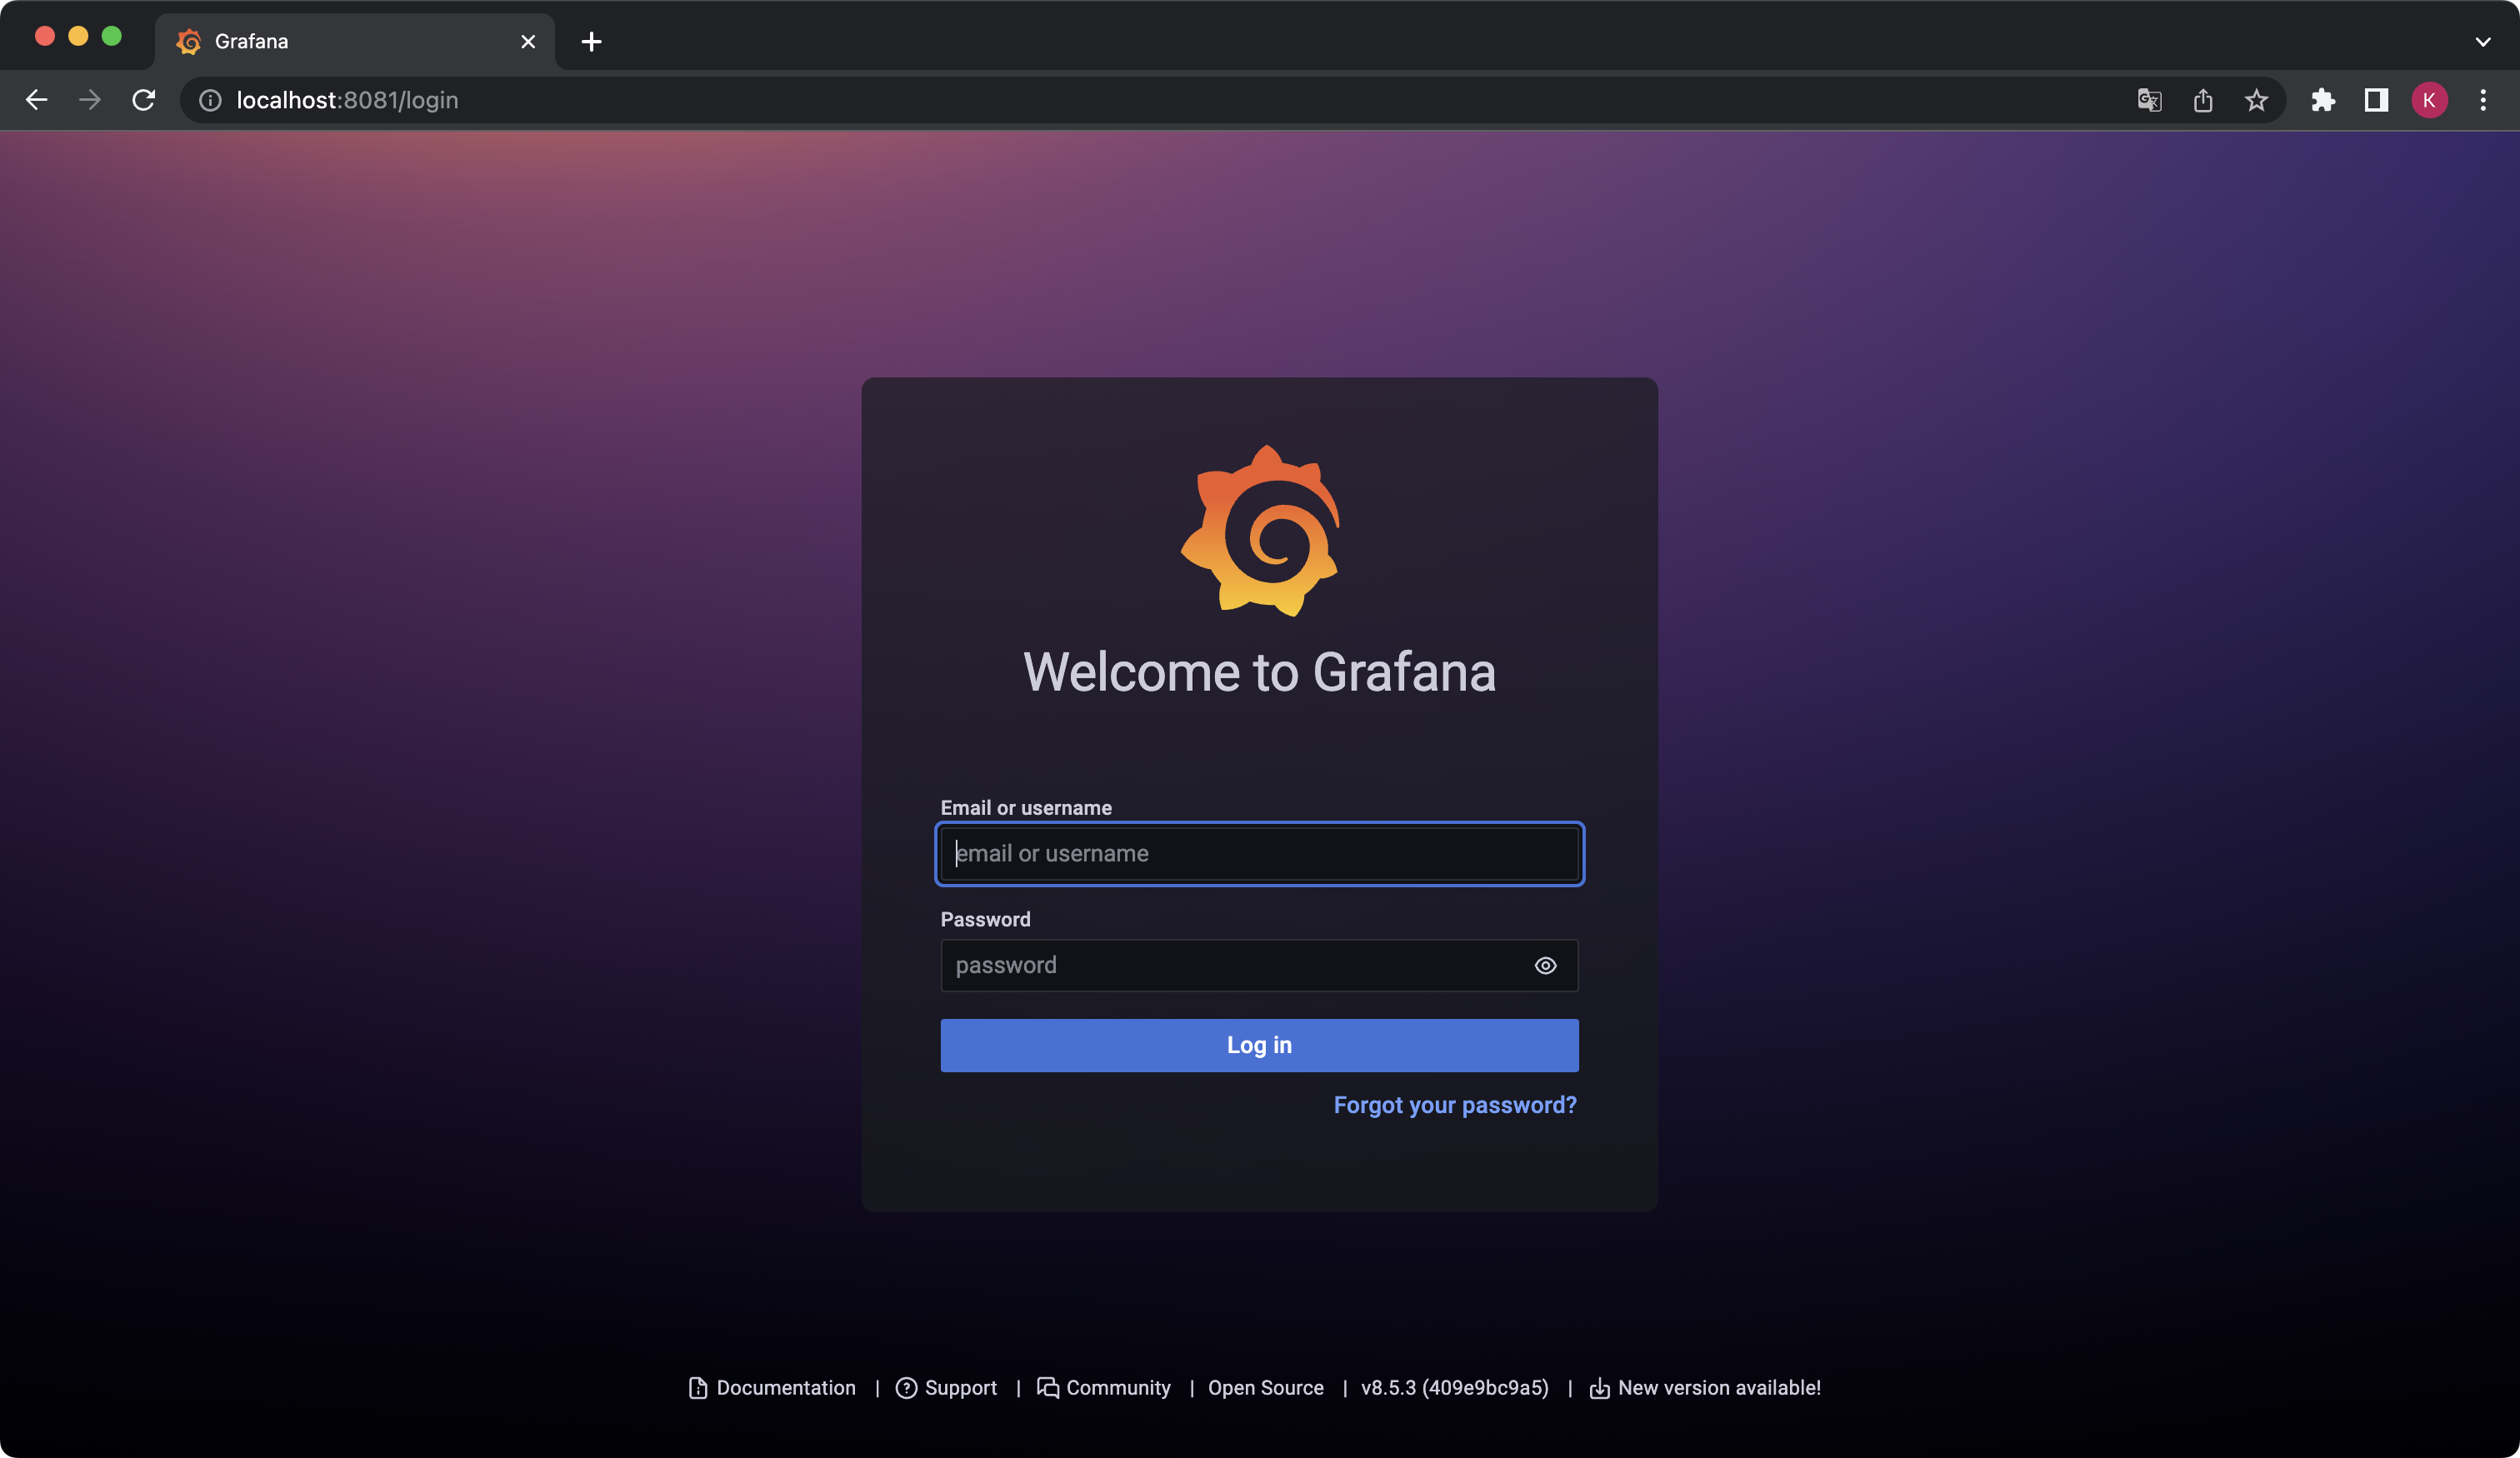
Example input:
Username: admin
Password: prom-operator
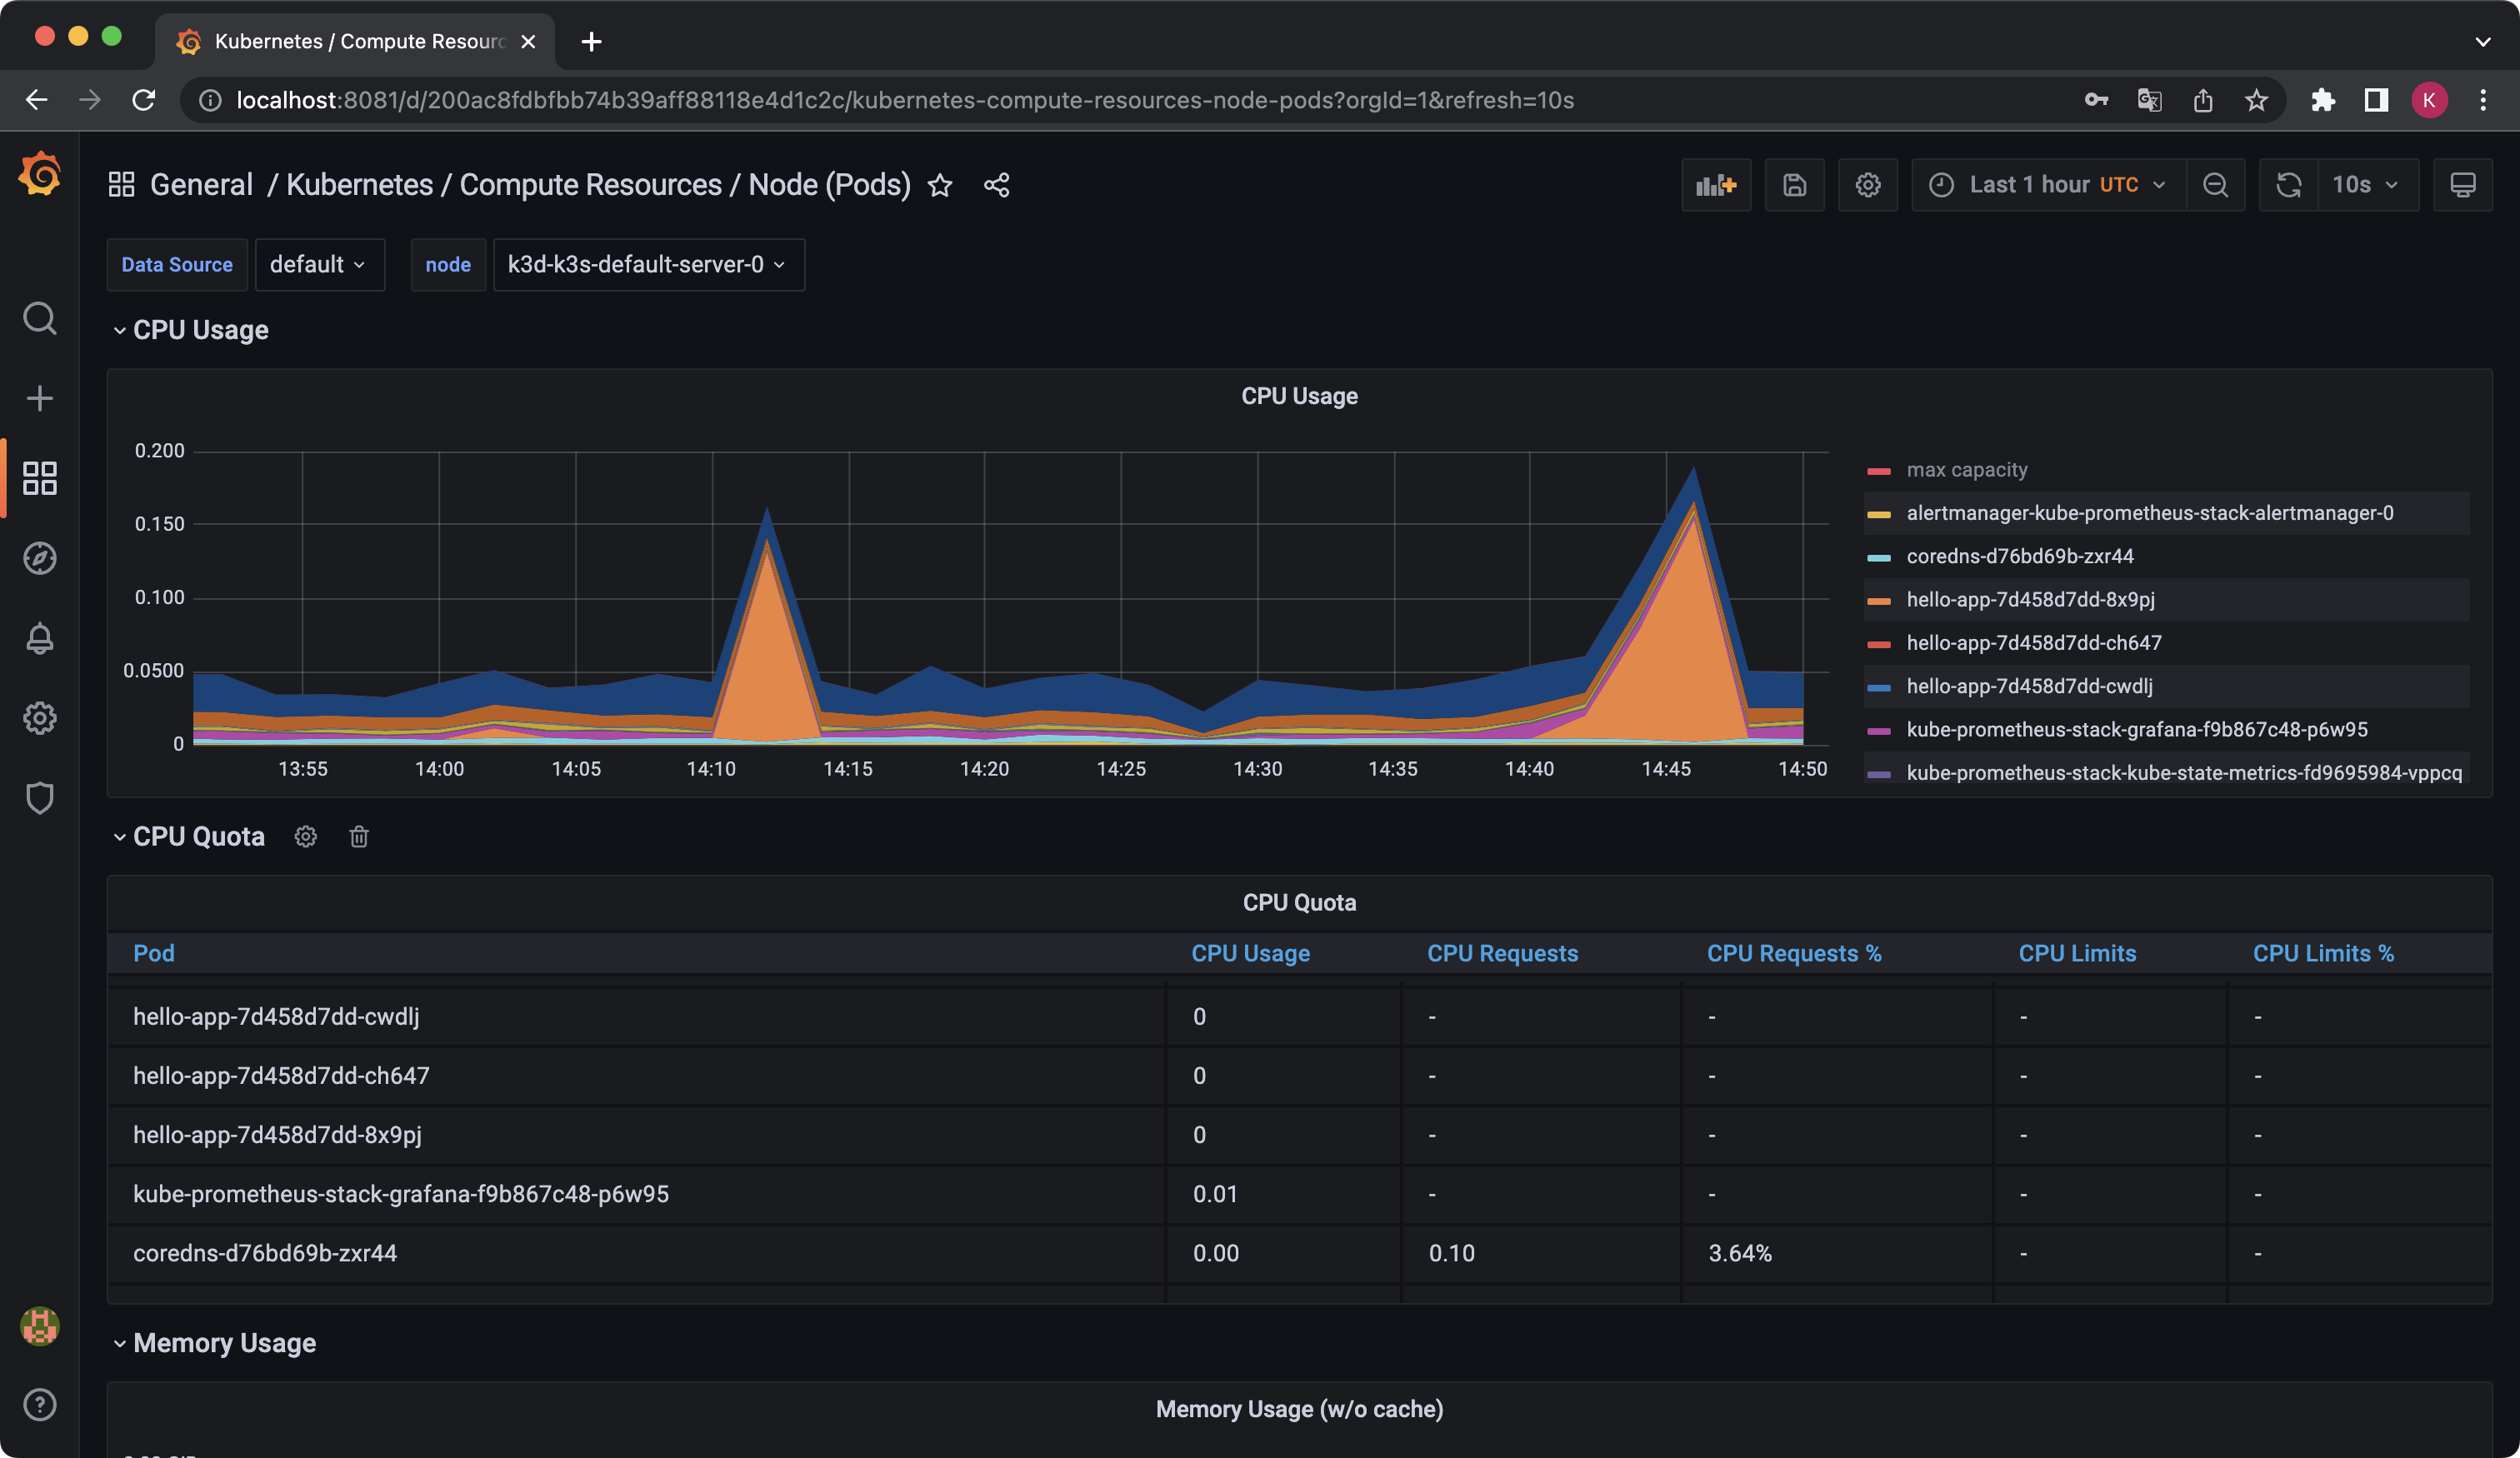
Dashboards
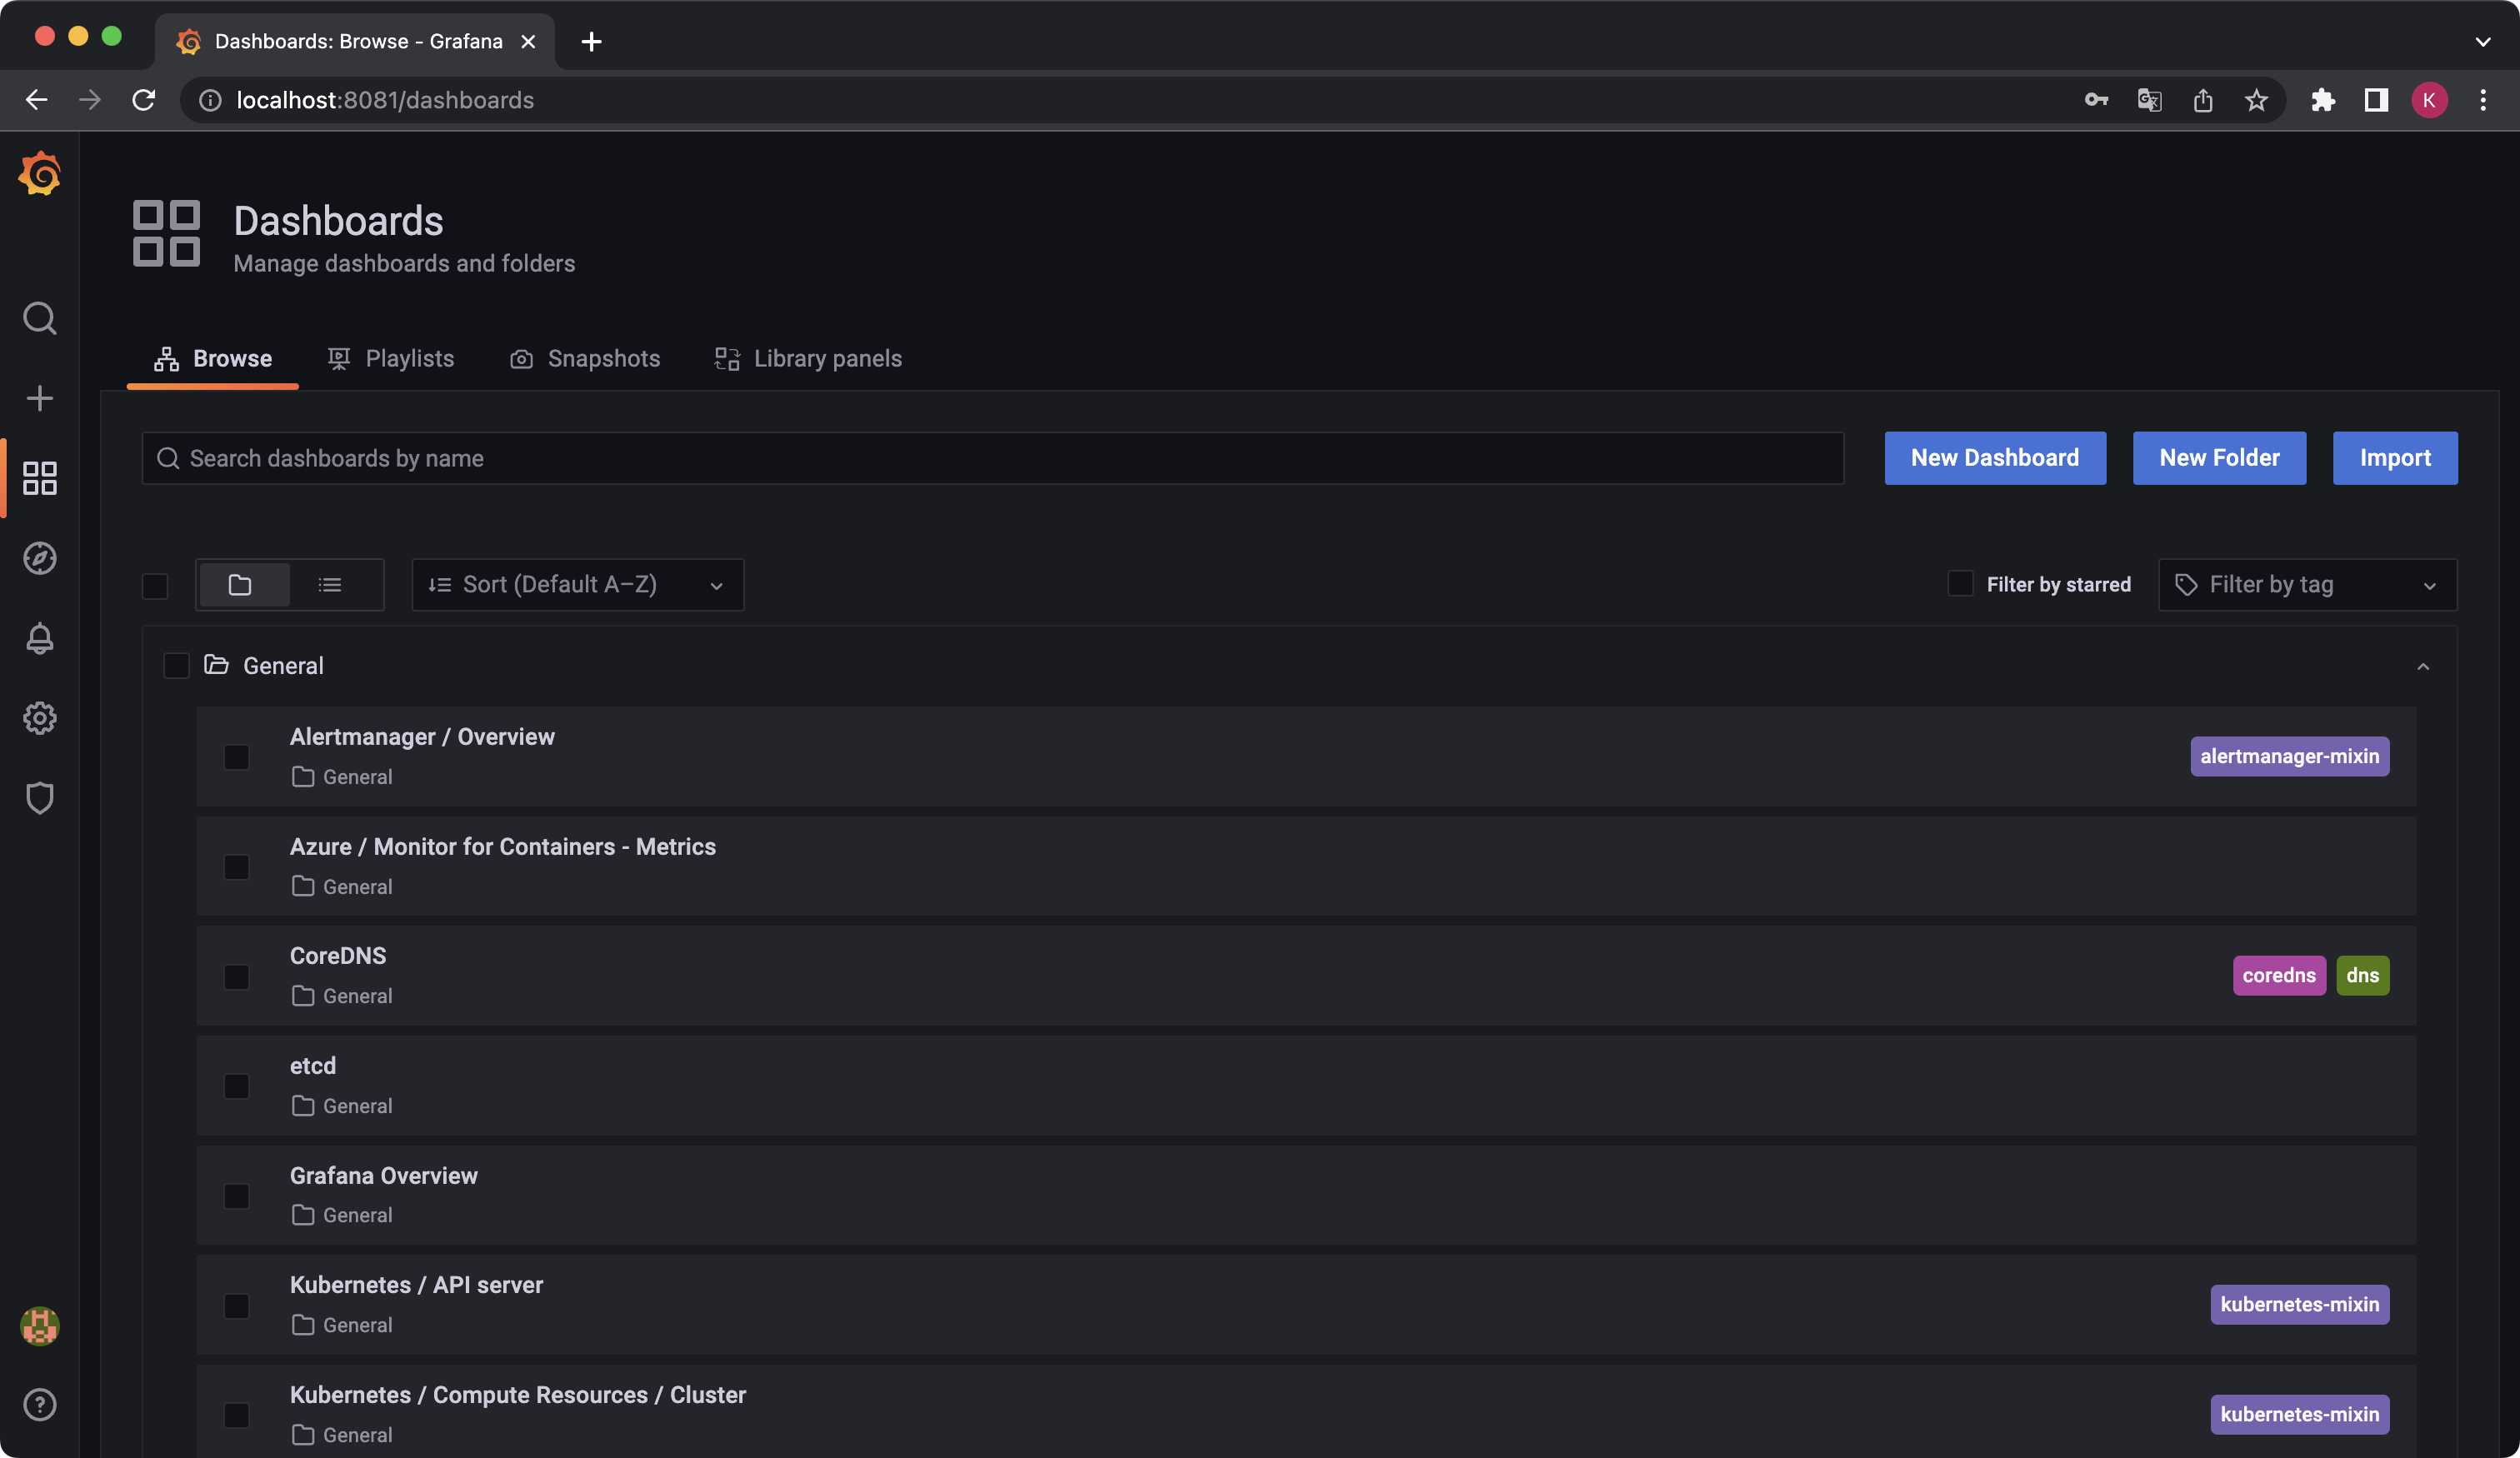
Example screen 1
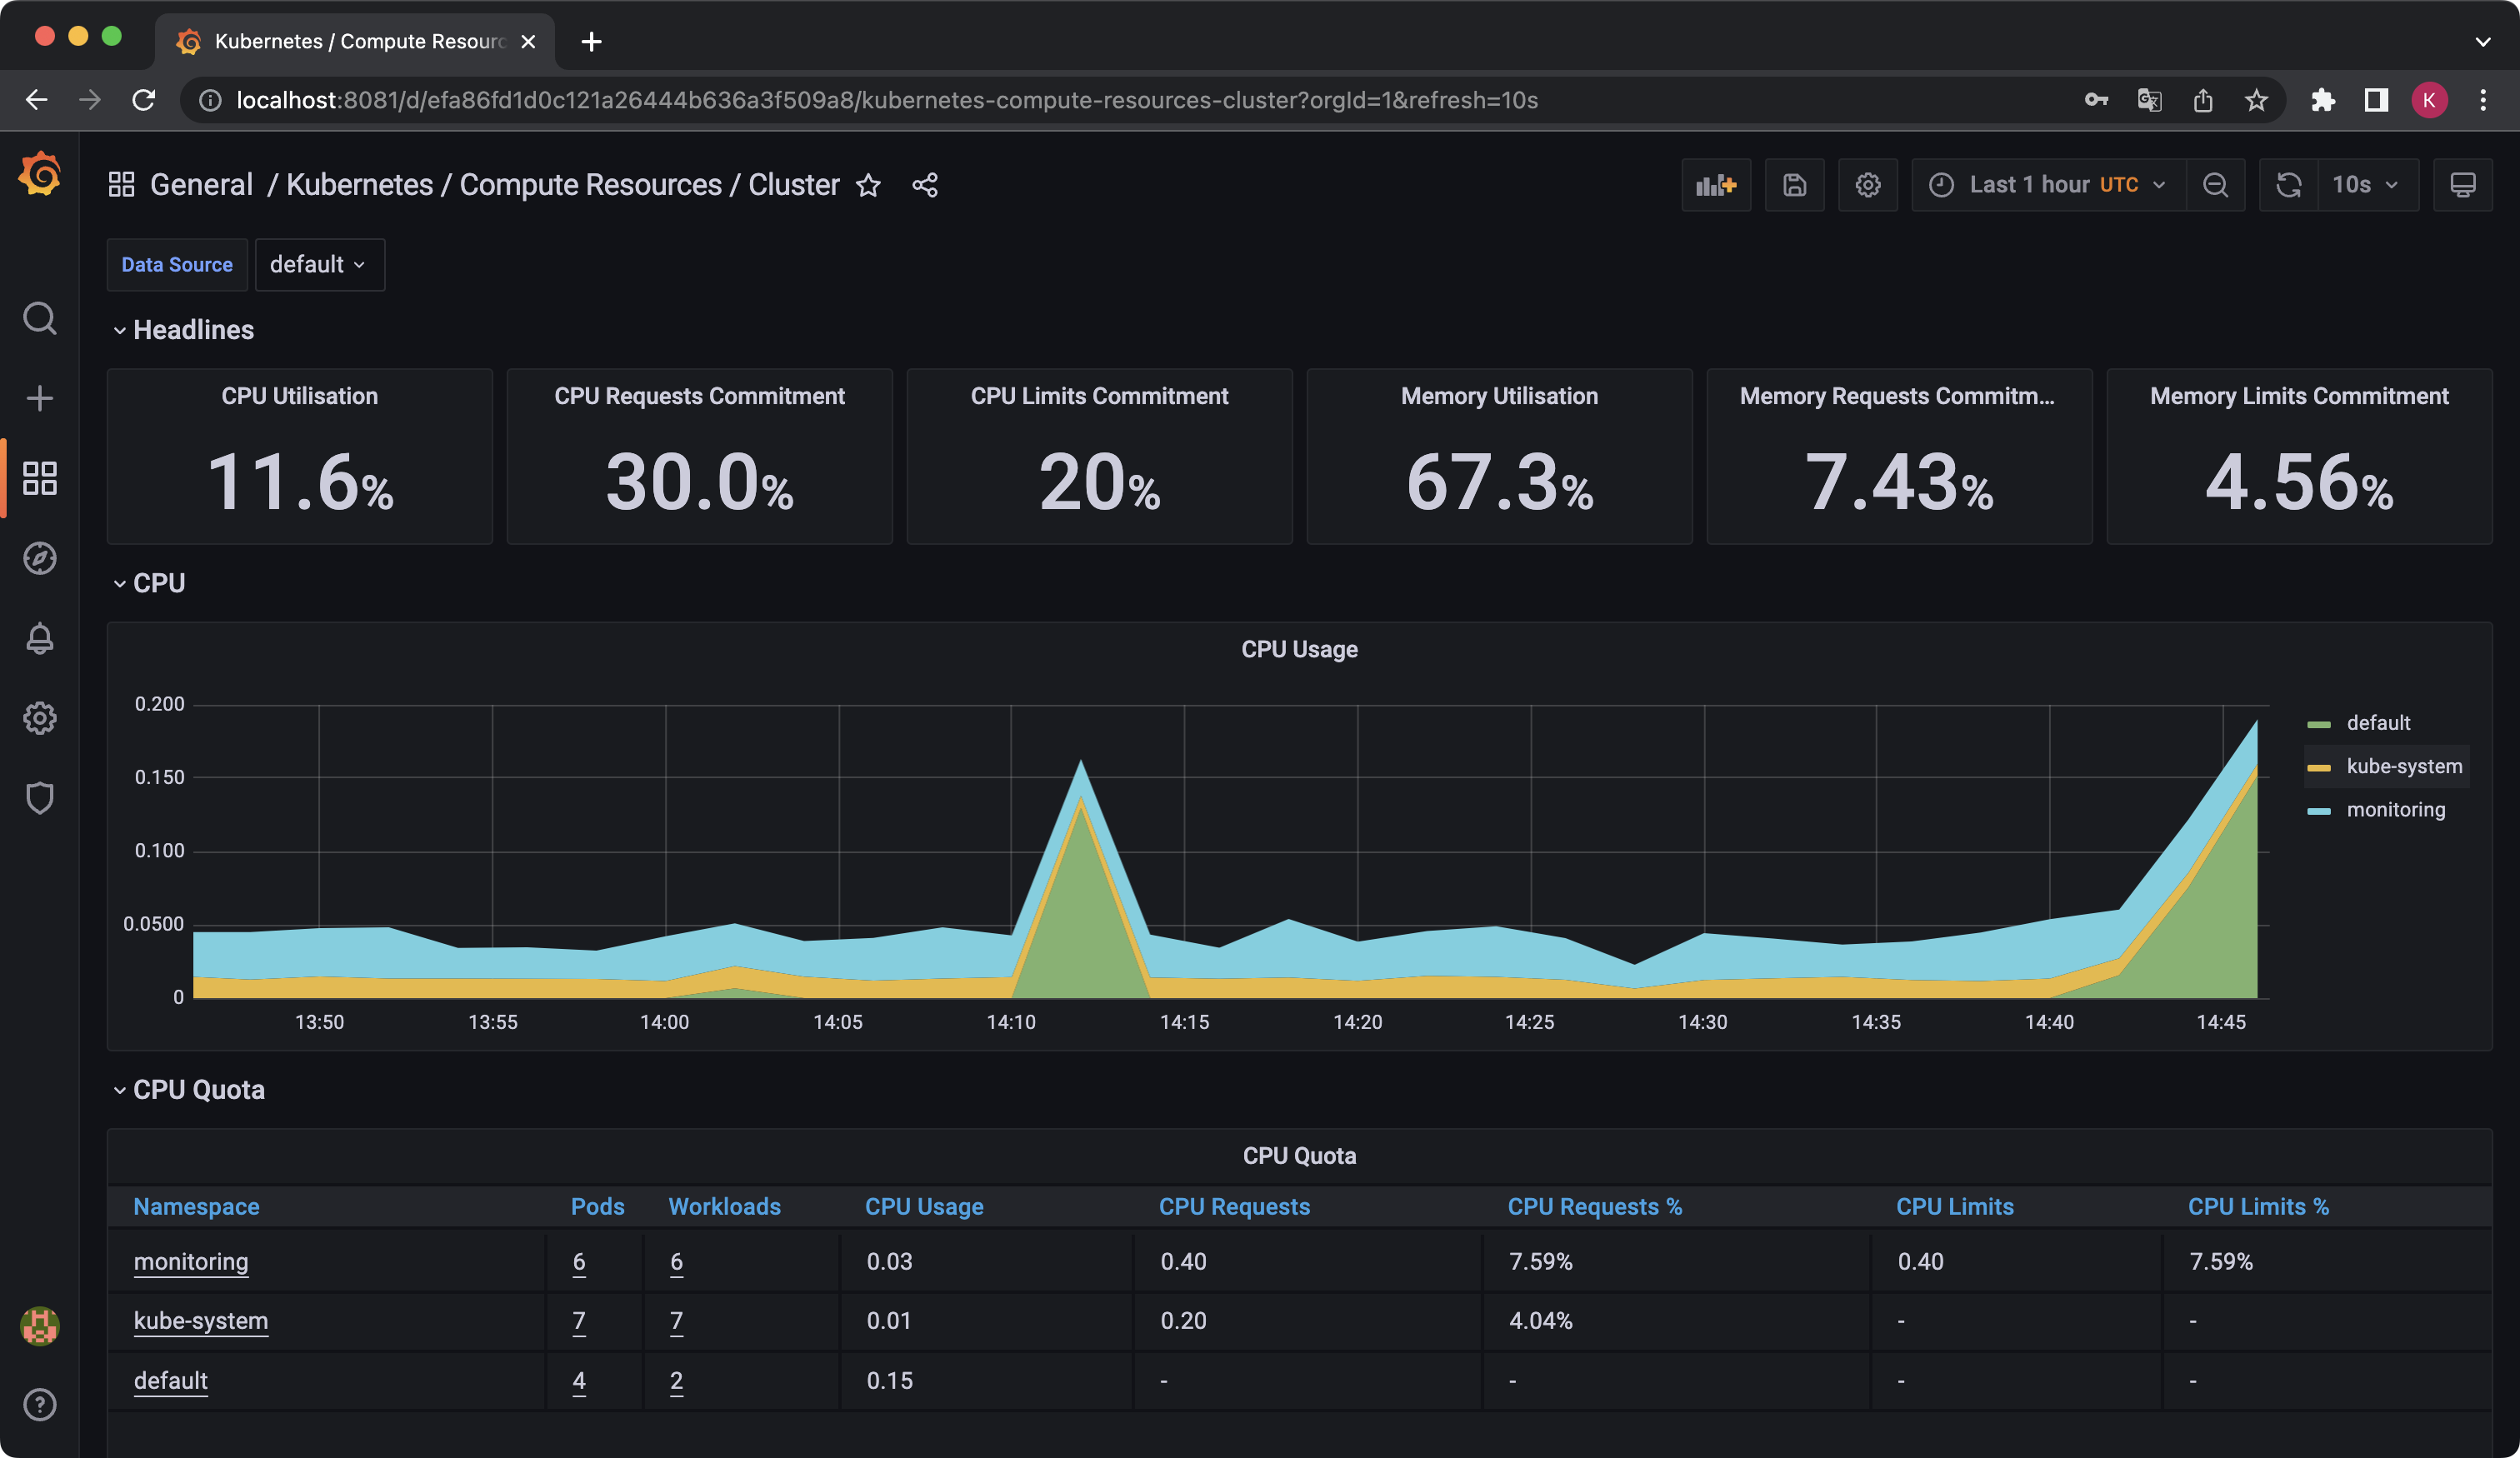
Example screen 2
Destroy Kubernetes cluster
k3d cluster delete
What about multi-node cluster?
Create multi-node cluster
k3d cluster create --agents 2 --no-lb --k3s-arg "--disable=traefik@server:0"
Check multi-node cluster
k3d cluster list
Example output:
NAME          SERVERS   AGENTS   LOADBALANCER
k3s-default   1/1       2/2      false
Deploy kube-prometheus-stack
helm install kube-prometheus-stack prometheus-community/kube-prometheus-stack -n monitoring --create-namespace
Example output:
NAME                                                           READY   STATUS    RESTARTS   AGE   IP           NODE                       NOMINATED NODE   READINESS GATES
...
pod/kube-prometheus-stack-prometheus-node-exporter-m6r6s       1/1     Running   0          12m   172.21.0.3   k3d-k3s-default-agent-1    <none>           <none>
pod/kube-prometheus-stack-prometheus-node-exporter-65c8z       1/1     Running   0          12m   172.21.0.4   k3d-k3s-default-agent-0    <none>           <none>
pod/kube-prometheus-stack-prometheus-node-exporter-vdz97       1/1     Running   0          12m   172.21.0.2   k3d-k3s-default-server-0   <none>           <none>
...
As we can see, node-exporter as a deamon-set was deployed on every cluster node.
The rest is analogous to the single node cluster.